If you’ve spent any amount of time debugging software you know the amount of it one can end up wasting just continuously restarting your program in order to pinpoint where in your code base a given problem is located.
Even when you’ve located the problem it is sometimes difficult to reason through why things are not going according to plan in your code. Even more if you are not debugging your own code (or you wrote it more than two weeks ago).
Since I’ve been developing in Rust, the amount of time that I’ve spent debugging has decreased dramatically. All those compile time guarantees and expressiveness in the type system reduce the opportunities for bugs to creep in. But, once I need to debug something the flexibility of moving back and forth increases my productivity when a bug with sufficient teeth comes up.
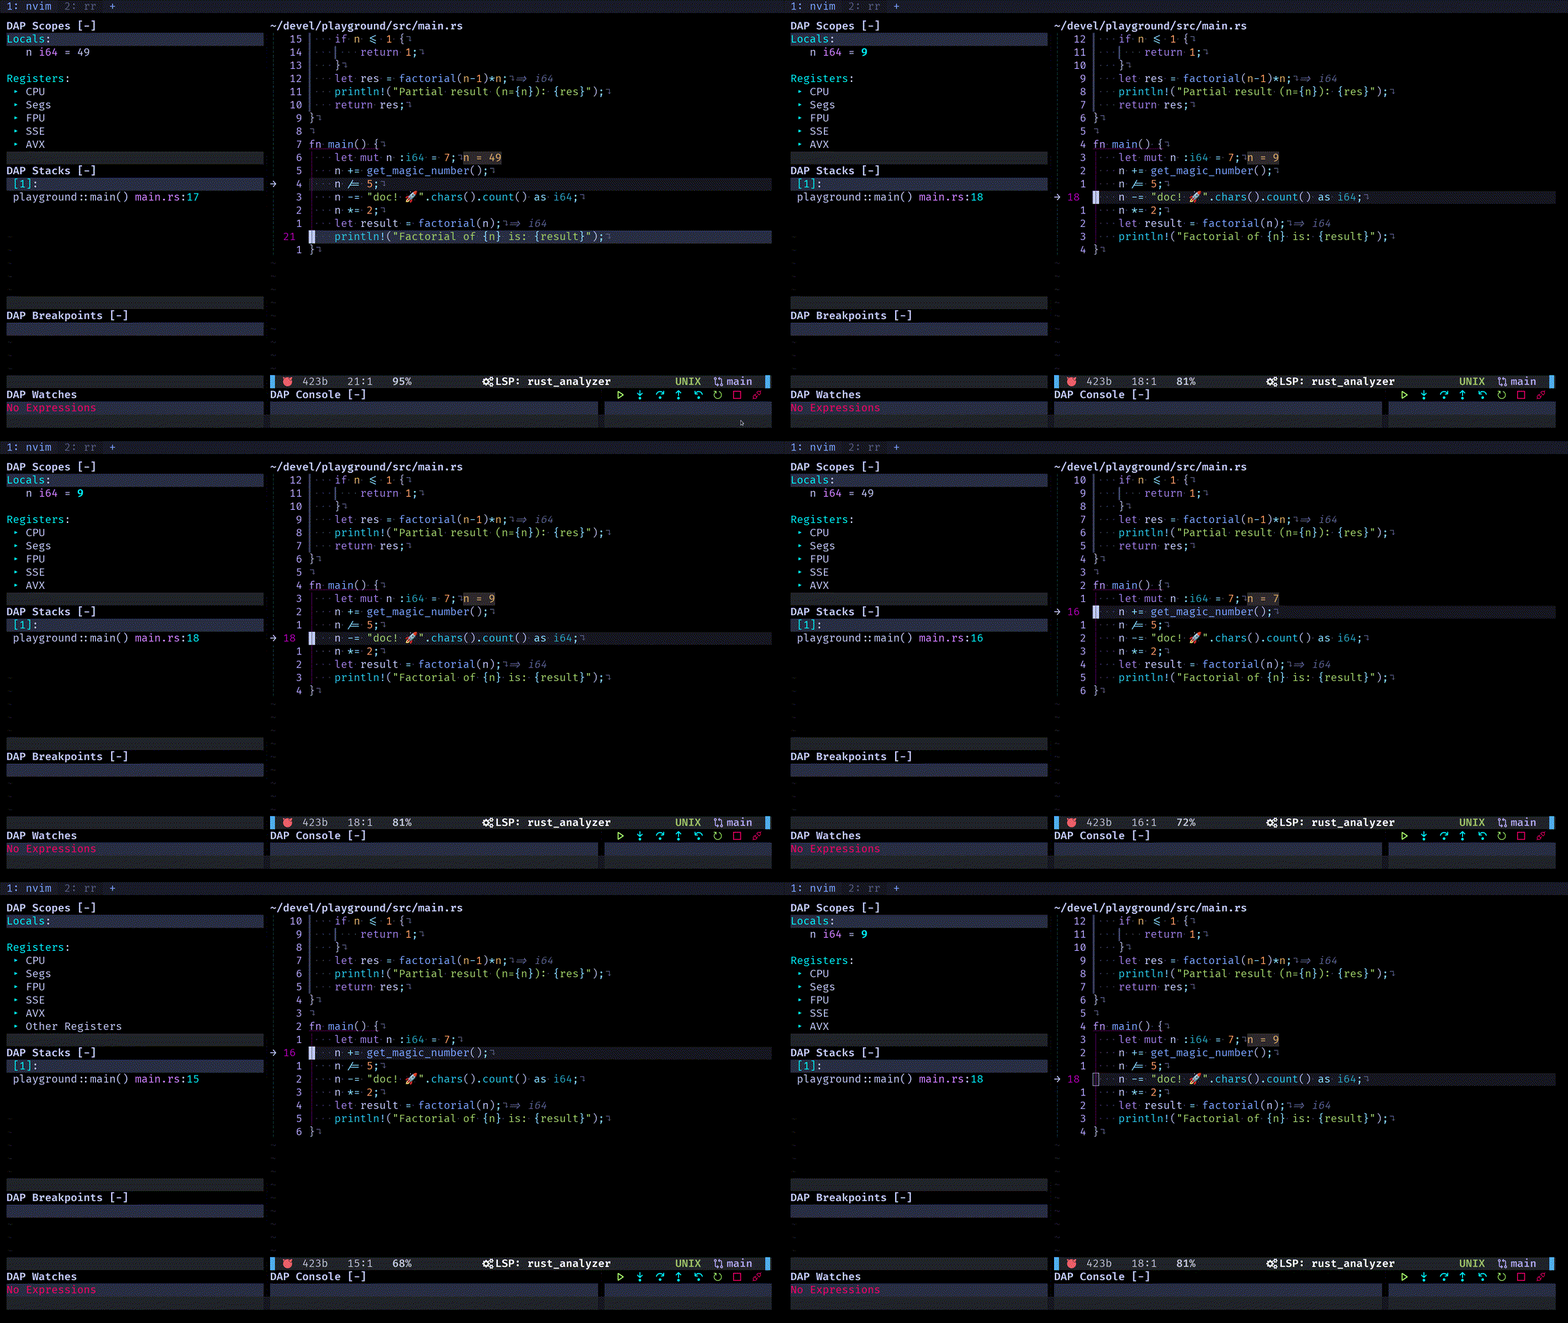
Wouldn’t it be nice if you could just go back?
Well that’s preciesly what rr allows you to do. Look right here:

So how do you acquire this power? And how do you use it?
We are going to configure rr for NeoVim, using the DAP (Debugger Adapter Protocol),
which most modern editors can handle. I’ve made a plugin to handle most of the
details of integrating rr with the vscode-cpptools
extension that is used to bring gdb to neovim through the DAP.
If you use a different editor you could always check the code and adapt the logic to your editor, or use gdb directly.
rr Basics
Depending on your Linux distro you might need to set the perf_event_paranoid level
to allow rr to work.
sudo sysctl kernel.perf_event_paranoid=1
In general you will first record an execution of your program with:
rr record <path/to/your/binary> <args>
This will generate a recording. To execute the recording run:
rr replay -s 50505 -k
This command will serve the replay session for you to connect to. You will be able to see in the response of the command the instructions to connect to the session by gdb.
We will however connect from our NeoVim editor using nvim-dap-rr.
NeoVim configuration
The plugin makes most of the heavy lifting, for local sessions you only need to set the mappings
of the debugger actions and append the generated configuration to your dap.configurations table.
For remote sessions or other debugger configurations see the
plugin readme
Here is the minimal configuration:
| |
Feel free to set the mapping to your liking, mine are set up to a QMK layer
that leaves the FN keys on my home-row. So most of the stepping functions correspond
to hjkl on a QWERTY keyboard.
We are ready, put your glasses on, the flux capacitor sometimes throghs off sparks!
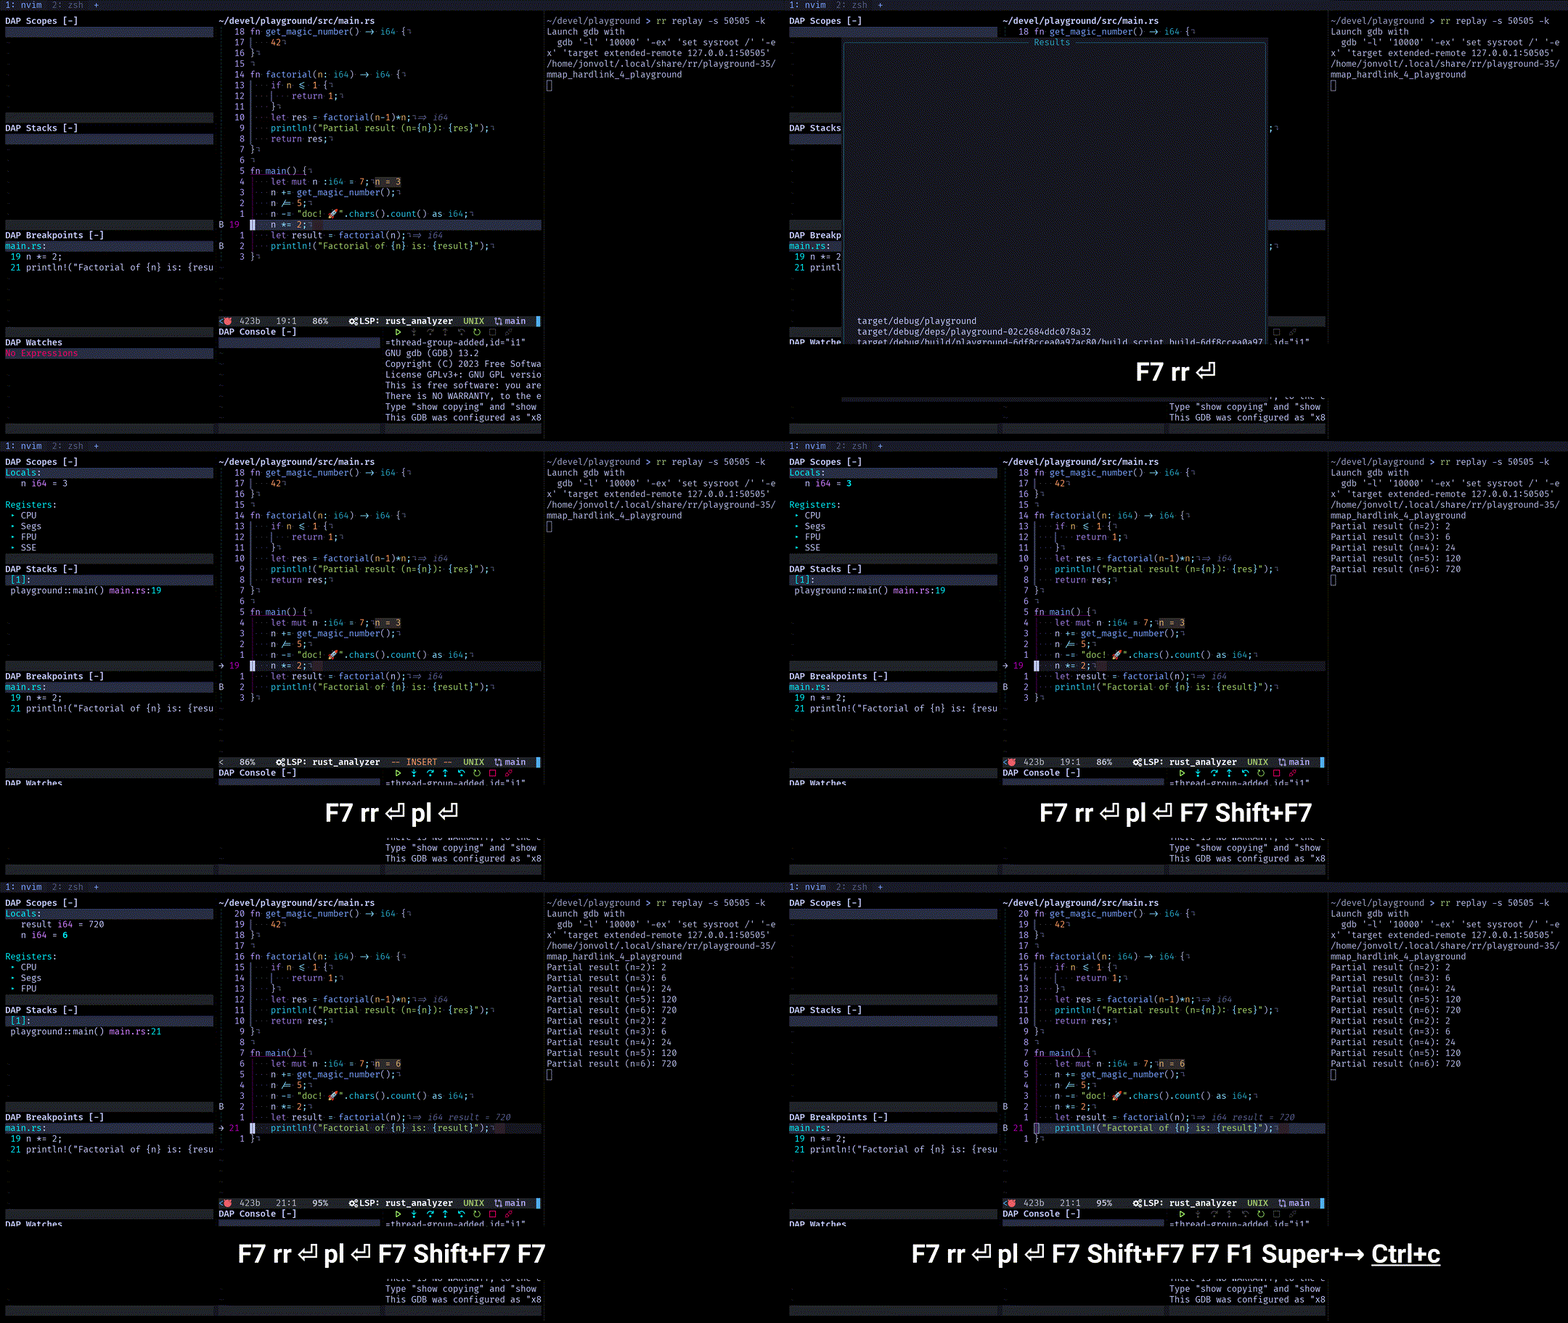
To start the debugging session you just need to have a rr session being served:
cargo build
rr record ./target/debug/playground
rr replay -s 50505 -k
Then in NeoVim press the key mapped to continue, in my case F7,
you’ll be prompted to choose the binary that we are debugging.
Once connected to the debug session using the step, reverse_step, continue
and reverse_continue functions, mapped to (<F7-10> and <S-<F7-10>> in my case)
you can freely navigate the state of your recording:

Cool, but will this work on any program?
You might be worried that this might only work on toy programs or be insufferably slow
on any real application complex enough to benefit from this kind of debugging.
You’ll be happy to know that rr is actually not that bad in this front, you can expect
your application to be 2 to 3 times slower than normal when using rr to record it.
Let me show you how you can debug Clippy, the Rust
linter with rr.
Debugging Clippy with rr
When you develop in Rust it is very common to run your application using cargo run.
But in order to record the execution of our application this is not advisable, as we would be
recording the code of cargo itself.
I’ve recently started contributing to Rust, and I wanted to explore how the
enum_variant_names lint
worked, so in this example we’ll use the clippy-driver binary with test/ui/enum_variants.rs
as its argument. This binary runs clippy on this test file.
In the case of clippy, to run without cargo dev lint we have to set LD_LIBRARY_PATH
following the instructions from the clippy documentation.
Then we run clippy-driver like this:
| |
In order to record the execution we run:
| |
Then we serve the replaying:
| |
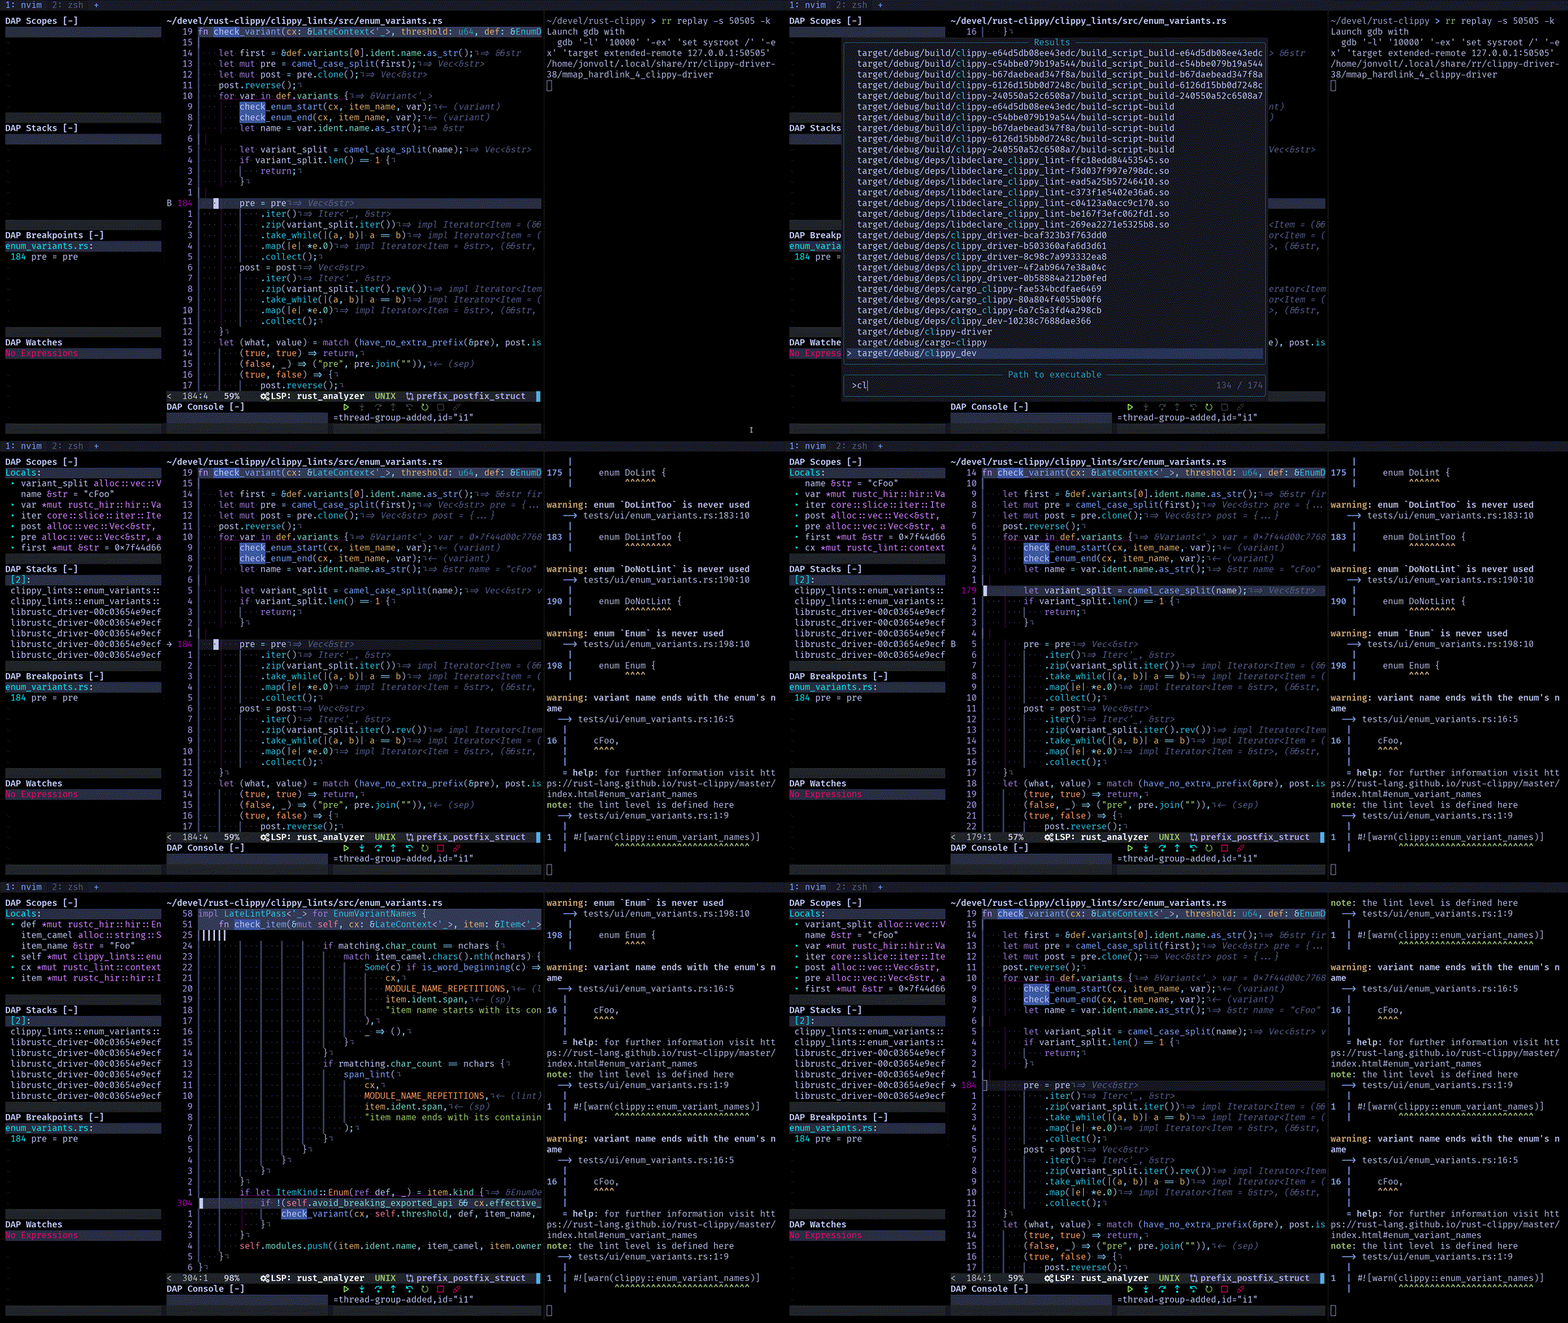
And finally we can debug on our editor:

In the gif I’ve placed a breakpoint in the check_variant function and using the reverse_step_out
function (keybinded) I’m able to set the state of the program to the moment just before check_variant
was called.
I find this very helpful to look for the moment in which the state of my program stops being the expected.
At that point, instead of restarting the debugging, with rr you can just reverse_step_out, check if
the state is the expected one and repeat. Running a kind of bisecting search on your bug with the state
of your program.
Conclusion
As you’ve seen setting rr to debug your programs is reasonably easy and the configuration for integrating it
with NeoVim is as well using nvim-dap-rr.
In this case I’ve used Rust, but rr can be used to debug C++ and C binaries as well.
rr opens a world of possibilities for debugging, on top of Rust already fantastic properties, it can help
further decrease the amout of time you spend debugging.